Using Python, OpenCV and AWS Lambda to gather crime statistics – Part 1
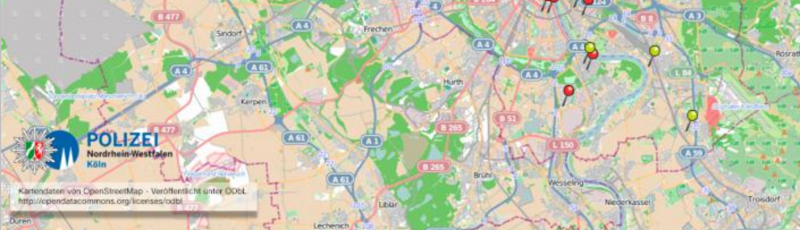
I want to buy a house in a nice neighbourhood. My local police department provides statistics, but they only offer a static image with the weekly break-ins superimposed on a map.
I contacted them to see if they could provide the raw data used to produce their map. They said that this is not something they can publish, as it contains private information. Strange, as they’re essentially publishing this already on their site, so let’s see if we can’t automatically convert their maps into usable data.
The first step — Data collection
The data seems to be published weekly on Monday mornings. The data is also published as far as I can tell by hand. They split the city into various regions. For example, one week the filename for region “3” is einbruchradar-koeln03.jpg, and another time it was einbruchradar-koeln03_3.jpg – maybe the poor summer student’s third try? The filesize also seems to vary between 700Kb and 2Mb for the same region, so different settings are used for compression. Finally, and most annoyingly, the maps are only roughly in the same location, you can see in the following image comparison that everything shifts by a few pixels (these are two consecutive weeks):
The goal for step 1 is to use BeautifulSoup to find the download link, grab the file, and put it in S3 for later processing. Once this is running, I can collect all the images and process them later.
This will be scheduled as an AWS Lambda function based on a CloudWatch cron job to run every Wednesday. This way, if whoever’s job it is to update this is sick on Monday, I have a two day buffer.
The python code below will look for the “Download jpg” text of each region of the city, pull the corresponding image, and save it to S3:
#!/usr/local/lin/python3
from bs4 import BeautifulSoup
import requests
import datetime
import urllib.request
import boto3

urllist = [
    'https://koeln.polizei.nrw/medien/stadtgebiet-leverkusen',
    'https://koeln.polizei.nrw/medien/westliche-stadtteile-bocklemuendehrenfeld',
    'https://koeln.polizei.nrw/medien/nordwestliche-westliche-stadtteile-chorweiler-heimersdorf',
    'https://koeln.polizei.nrw/medien/nordoestlicheoestliche-stadtteile-dellbrueckkalk',
    'https://koeln.polizei.nrw/medien/suedwestlichesuedliche-stadtteile-marsdorfsuelz',
    'https://koeln.polizei.nrw/medien/suedoestlicheoestliche-stadtteile-porzpoll',
    'https://koeln.polizei.nrw/medien/suedliche-stadtteile-meschenichgodorfsuerth'
]

imagelist = []

thisrun = int(datetime.datetime.now().strftime("%s"))

def getImageURL(url):
  # Get image from the URL - each page given in url will contain a main image; Return the image oject
  response = requests.get(url)
  soup = BeautifulSoup(response.content, "html.parser")
  for links in soup.find_all('a'):
      if 'Download jpg' in links.text:
          return links.get('href')

def saveImages(listOfImages):
    for image in listOfImages:
        filename = image[image.rfind("/") + 1:]
        imagedata = requests.get(image).content
        s3 = boto3.resource('s3')
        s3.Bucket('nrw-police-stats-images').put_object(Key=str(thisrun) + '-' + filename, Body=imagedata)

def handler(event, context):
    for stadtteil in urllist:
        imagelist.append(getImageURL(stadtteil))
    saveImages(imagelist)

# In case we're not running in Lambda, allow for CLI Tests
if __name__ == "__main__":
    handler(0,0)
The Lambda setup was very easy and allows me to forget that this is running at all. In a few weeks, I’ll have a bunch of images in my bucket for analysis & consolidation.
Stay tuned for Part 2
1 thought on “Using Python, OpenCV and AWS Lambda to gather crime statistics – Part 1”
Comments are closed.